Tides
Overview
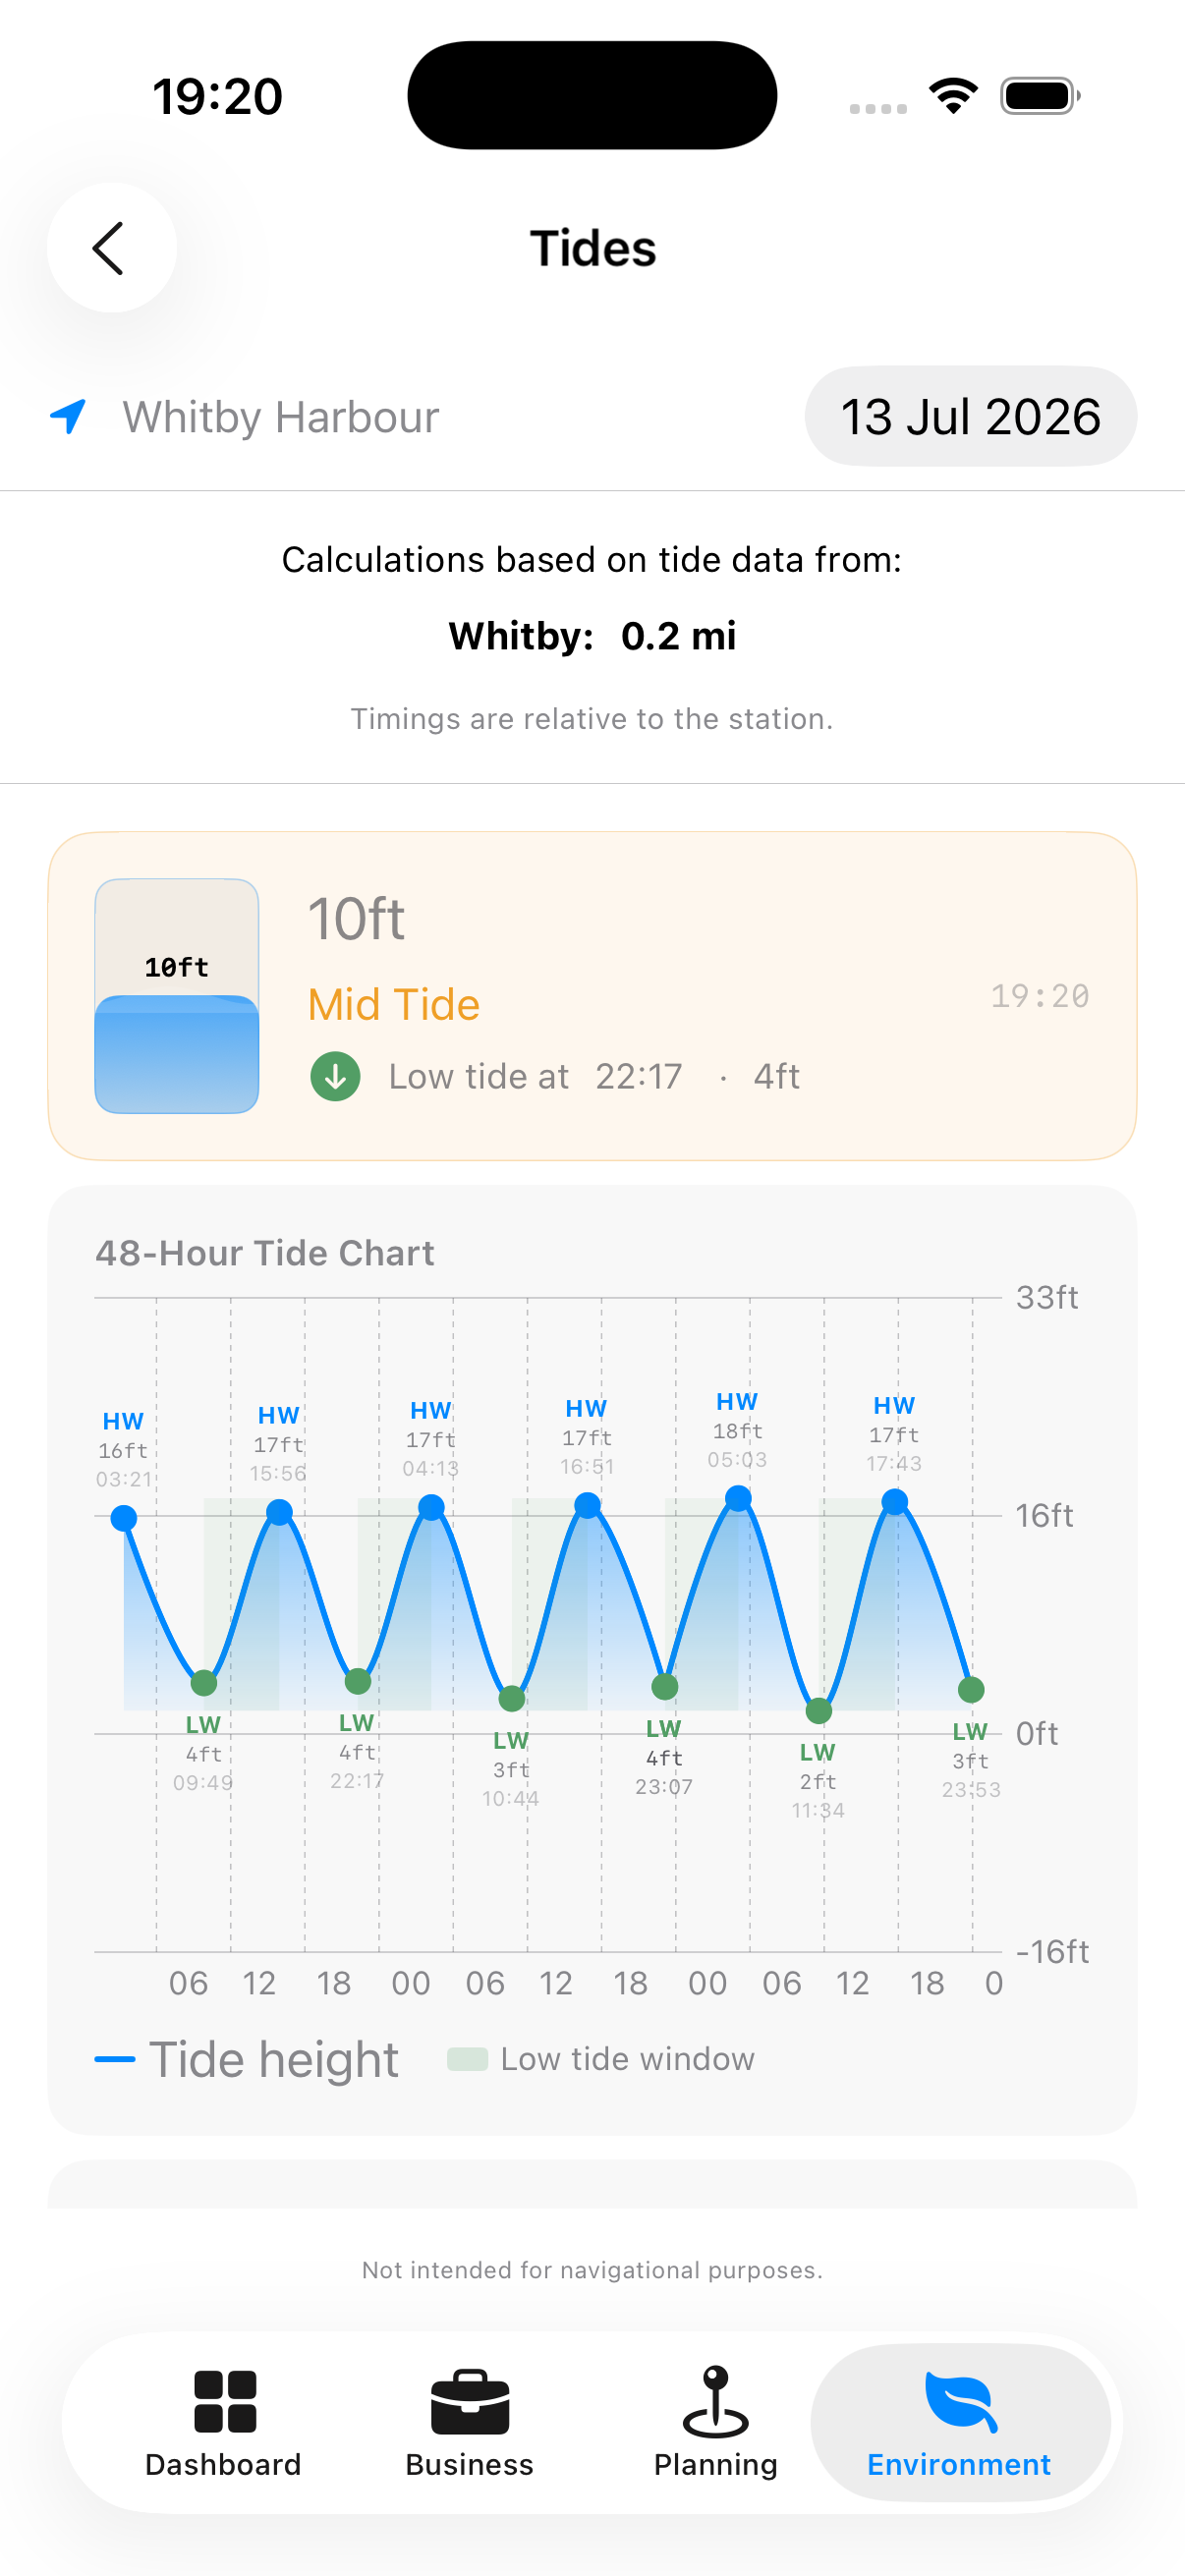
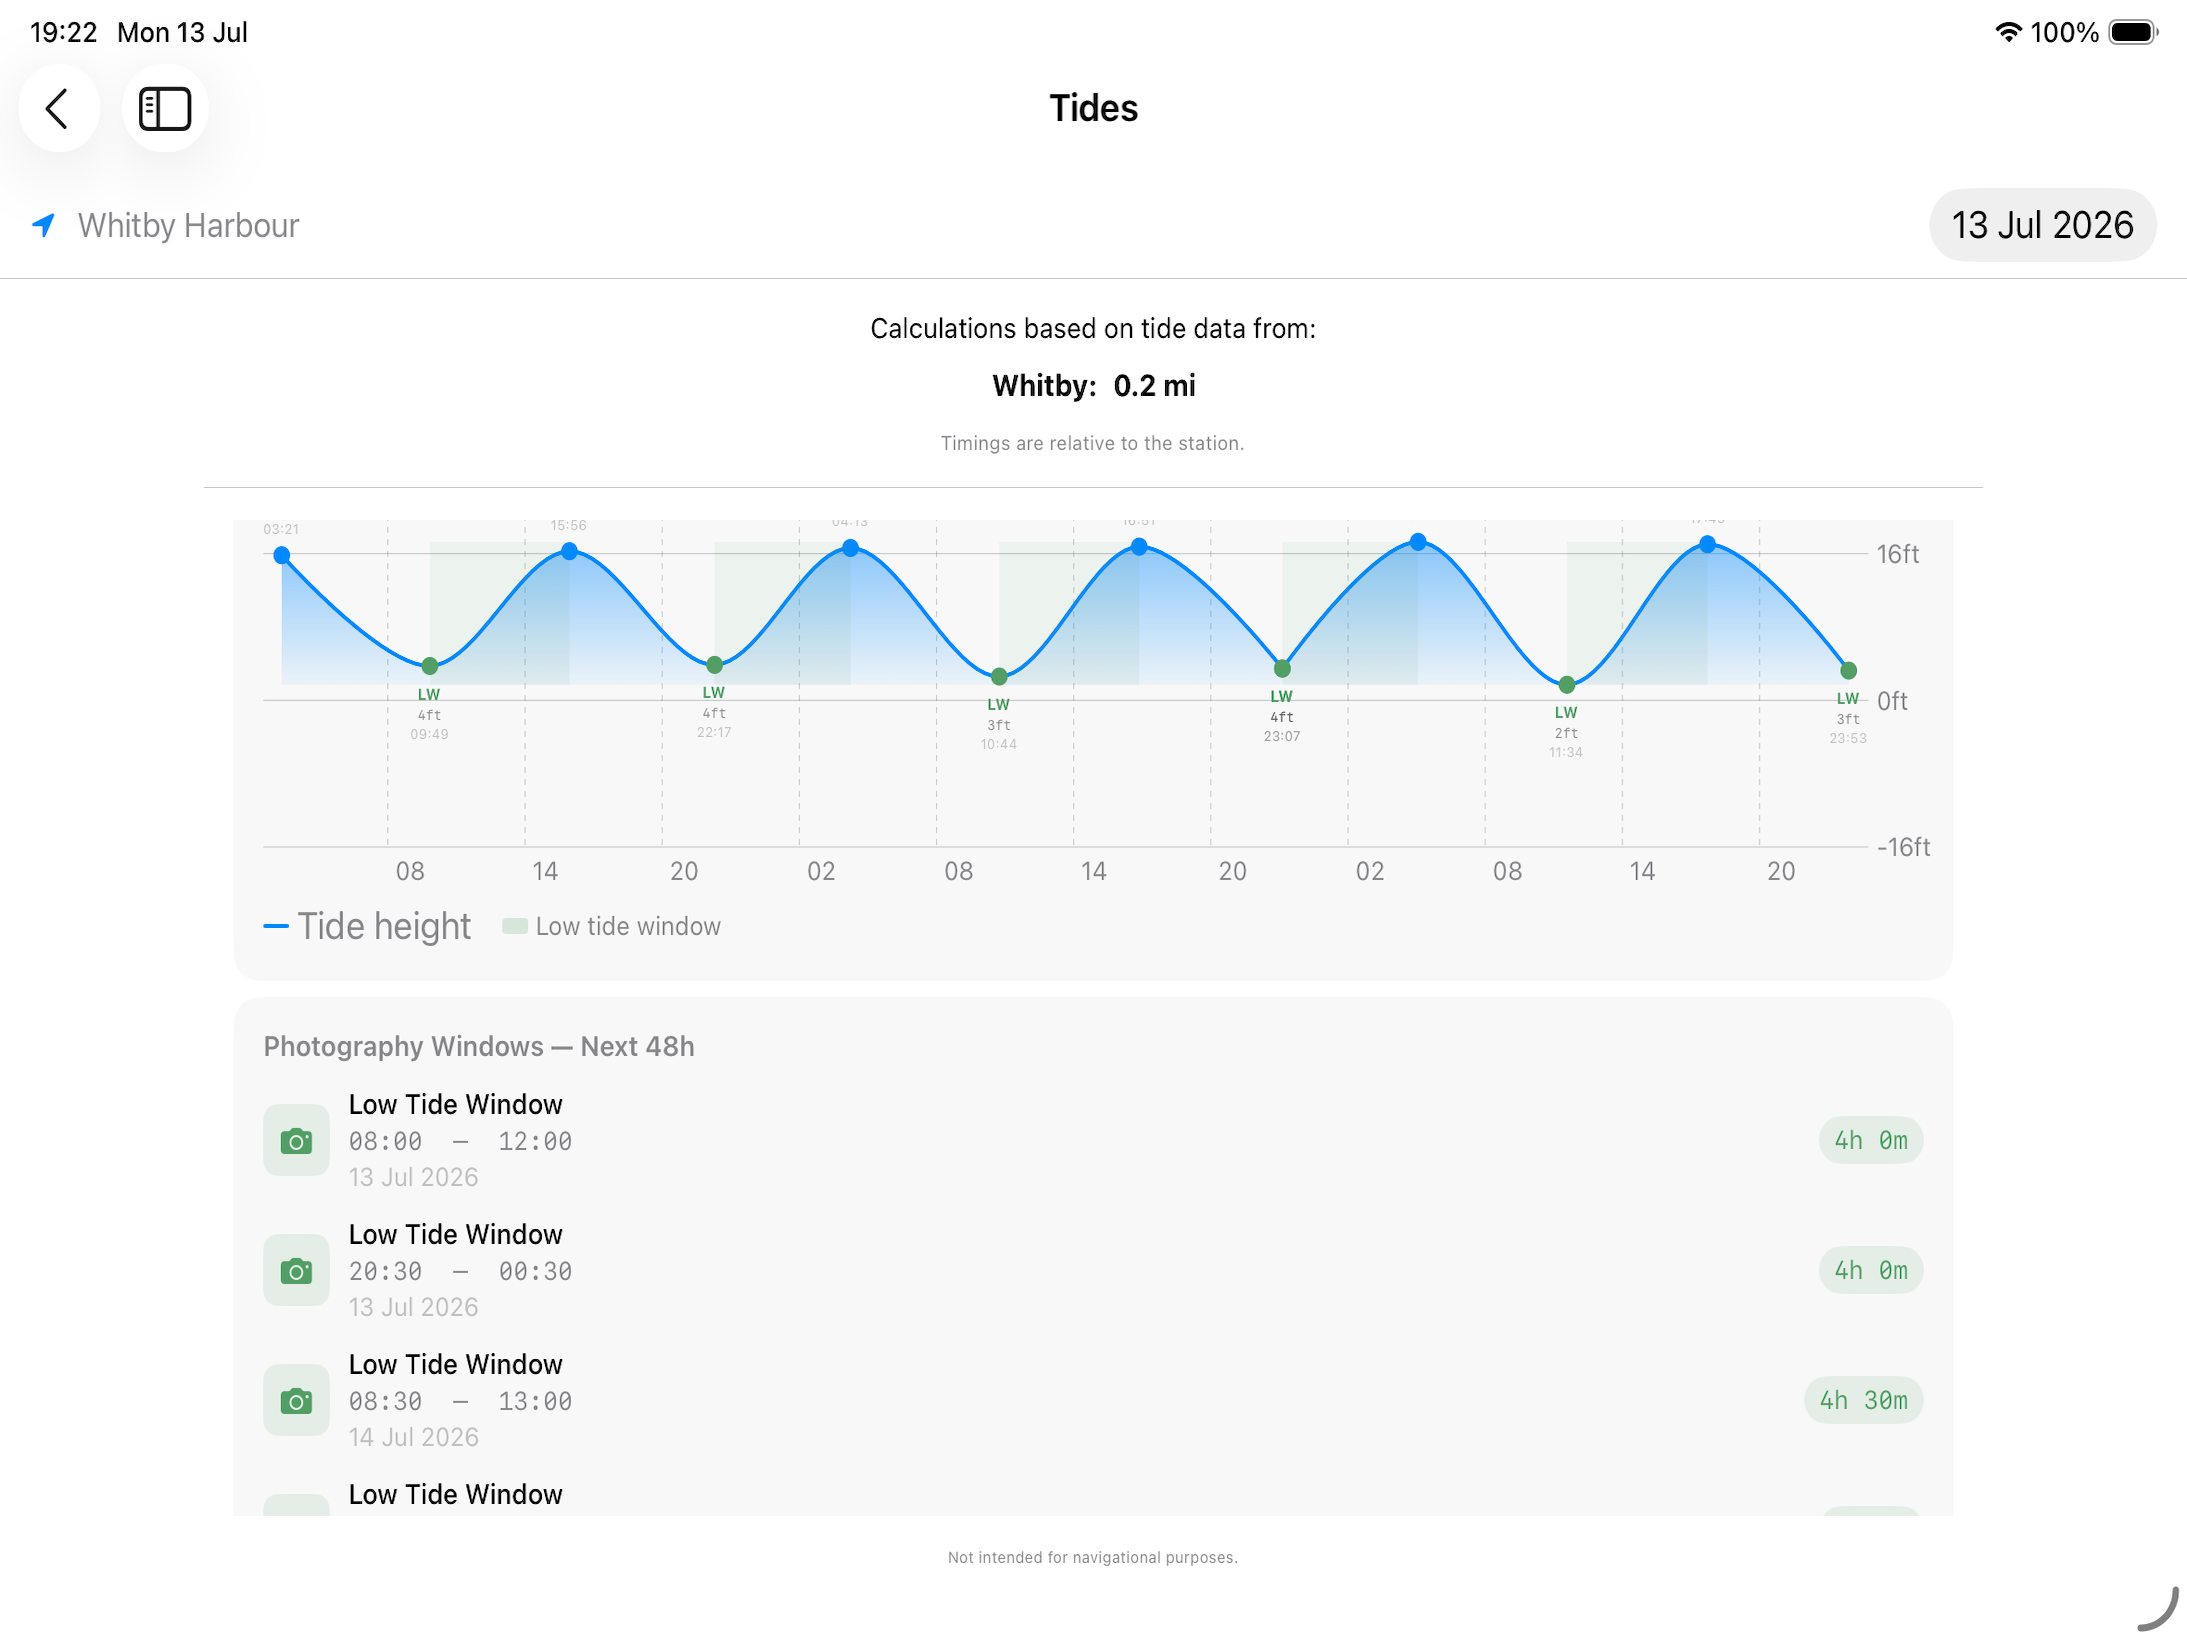
The Tides module shows 48-hour tide height predictions for any coastal location, identifies high and low tide extremes, and highlights the best photography windows (when tides are neither too high nor too low for coastal shooting).
Accessing Tides
Environment tab → Tides
What Is Displayed
Tide Chart An interactive height-over-time chart for the next 48 hours. The x-axis is time; the y-axis is tide height in metres. The current time is marked with a vertical line.
Tide Gauge A visual dial showing the current estimated tide height relative to the day’s range.
Extremes Table A table listing all predicted highs and lows for the next 48 hours:
- Time of extreme
- Type (High / Low)
- Predicted height (metres)
Photography Windows Card Highlights the time windows when tides are in the optimal range for beach and coastal photography — typically mid-tide when interesting foreground features (rocks, sand patterns, tidepools) are exposed but the tide is still active.
Changing Location
Tap the location selector to choose any of your saved coastal or seascape locations. The tide chart updates to the nearest tide prediction station.
Tip: Tide heights vary significantly even over short distances, especially in estuaries or complex coastlines. Always cross-reference with local tide tables for critical shoots.
Being Cut Off by the Tide
For a coastal location where the water can strand you, set a Safe Height on the location. Bookings there then show when the tide reaches it, how long that leaves you, and when it drops back — see Tide Cut-Off.
Disclaimer: While every effort is made to generate accurate Tidal Predications, they ARE NOT designed for Navigation Purposes